
CMOR Mapping
Cmor Mapping Mida001s Mid-atlantic Simrad
Cmor Mapping Mida001s Mid-atlantic Simrad
Couldn't load pickup availability
CMOR Mapping Mid-Atlantic CMOR Card for Navico
Model: MIDA001S- Chincoteague Shoal
- Delaware Bay
- Fenwik Shoal
- Hudson Canyon
- Ocean City Inlet
- Wrecks 30nm Due East Chesapeake Bay
- All CMOR Cards come on Micro SD cards with a standard SD adapter included.
CMOR cards for Navico products are compatible with:
Lowrance
HDS Gen1 series
HDS Gen2 series (both keypad and touchscreen)
HDS Gen3 series
HDS Carbon
Elite HDI series
Elite CHIRP series
Elite Ti series
HOOK series
Simrad
NSS
NSS evo2
NSS evo3
NSE
NSO
NSO evo2
NSO evo3
GO XSE
GO XSR
Mercury VesselView
502
702
703
903
B&G
Zeus
Zeus Touch
Zeus2
Zeus3
Vulcan
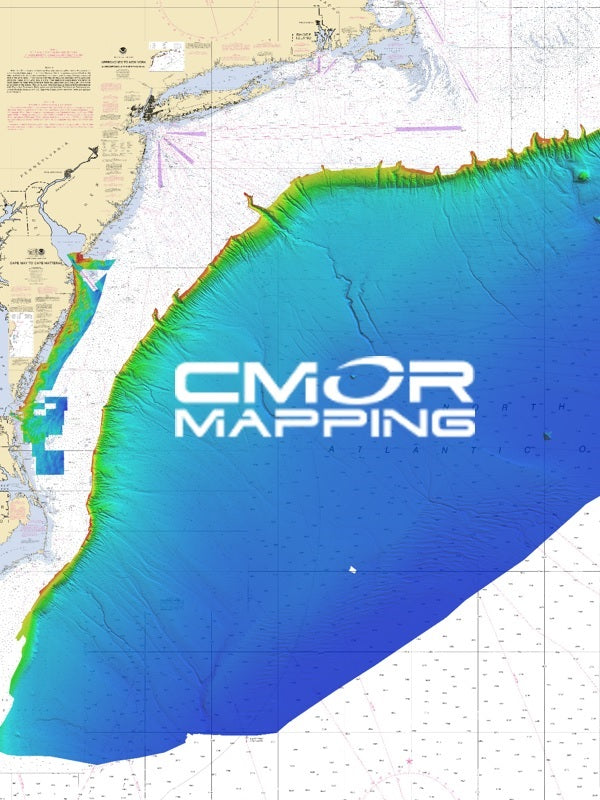
This card features some of the best fishing spots and wrecks in the Mid Atlantic with coverage starting nearshore to 20+ miles offshore, from Delaware Bay south to Virginia Beach & the NE canyons from North Carolina through Maine. Explore countless wrecks with detail like never before, drop or troll in a variety of depths, and finally pinpoint and hook that elusive species you have been waiting to box. Whether you are looking for quick hits with our nearshore data or cruising out to catch some serious wreck fish, this is the card for you!
Now, though, CMOR Mapping’s chartplotter-compatible bathymetry reveals those spots for the first time. With resolution as high as 1 meter (each pixel represents a single square meter of bottom) and coverage of the entire bottom, you see every bump in remarkable detail. Just as importantly, you see the areas of featureless underwater desert, where you don’t need to spend your time looking.
Most fishing maps and charts that show depth contour lines interpolate those lines from historical sounding data. In other words, the contours are drawn by looking at the measured depth at a number of points and then making educated guesses about what the bottom looks like between those points. In many cases, the results are fairly accurate. But isolated features — a 5-foot ledge between two soundings a quarter mile apart, for example — are easily missed.
In contrast, CMOR Mapping data is the result of methodical surveys with high-resolution echosounders. There is no interpolation, no guesswork, and no unverified "hotspots" reported by local captains. All you see is a complete, accurate, and highly detailed representation of the bottom, including many features that are not shown on any other chart or fishing map.
The value of CMOR Mapping imagery when fishing or diving a new area is obvious — instead of relying on "public numbers" or feeling your way along looking for more productive spots, you’re immediately in the game.
Not only will you see features you never knew existed — things you may have run right past a hundred times — but you’ll also see known features in game-changing detail. Large, dispersed artificial reef areas, for example, come into an entirely new level of focus, with each individual piece of structure clearly visible.
Share